on March 11, 2022
During a discussion of troubleshooting query timeouts in Azure SQL Database recently, I thought – hey, I wonder if you can find queries that timed out in Query Store?
Turns out, you can.
Query timeout essentials
Here are some basics regarding query timeouts for SQL Server, Azure SQL Database, and Azure SQL Managed Instance:
- Execution timeouts are NOT set or enforced by the database engine. It is happy to wait for your query to run or for your transaction to be open for hours, days, or years, until you commit, cancel, or get disconnected.
- Timeouts are set by the calling application. If you don’t explicitly set a timeout on your connection string, there is generally a default timeout that is used. Often, this is 30 seconds for query execution timeouts.
- Connection timeouts are different than execution timeouts. If you see a connection timeout, often this is a firewall or network issue preventing you from connecting to the database – or perhaps it’s even offline. Execution timeouts are when the calling application doesn’t want to wait any more for a query to complete.
The traditional way of finding query timeouts
If you start seeing query execution timeouts from an application, you don’t always get information about exactly what query had the problem in the error. The first steps are often to identify that query.
The “classic” way to do this is to run a trace against your database, using either classic SQL Trace (perhaps with Profiler), or an Extended Events trace. You trace to find an Attention event, which is also known as Error 3617.
This isn’t a bad way to go about things, but it’s time consuming and inconvenient: you generally only start tracing after you get a timeout error, and then you need to wait for the issue to happen again.
Finding timeouts in Query Store
If you’ve enabled Query Store, you may be able to find timeouts immediately, without running a trace.
There’s a caveat here: Query Store doesn’t necessarily collect every query. The QUERY_CAPTURE_MODE setting may be set to AUTO, which works to balance the space taken up by plans and doesn’t necessarily capture all queries.
Let’s cause a quick timeout and view it in Query Store.
Reproducing a query execution timeout
SQL Server Management Studio conveniently lets you set an execution timeout in the session options when you connect to a database. We’re going to take advantage of this to reproduce an execution timeout. I’m using the ContosoRetailDW database for this example, but you can adapt this pattern to any database suitable for testing (where blocking and possible data loss are OK).
I’ve enabled Query Store on the database with the following options:
ALTER DATABASE [ContosoRetailDW]
SET QUERY_STORE = ON
    (
      OPERATION_MODE = READ_WRITE,
      CLEANUP_POLICY = ( STALE_QUERY_THRESHOLD_DAYS = 90 ),
      DATA_FLUSH_INTERVAL_SECONDS = 900,
      MAX_STORAGE_SIZE_MB = 1024,
      INTERVAL_LENGTH_MINUTES = 60,
      SIZE_BASED_CLEANUP_MODE = AUTO,
      MAX_PLANS_PER_QUERY = 200,
      WAIT_STATS_CAPTURE_MODE = ON,
      QUERY_CAPTURE_MODE = ALL
    );
ALL may not be the best QUERY_CAPTURE_MODE for production databases– in this case, it’s useful when I don’t have a real workload running. I’ve also raised the database compat level of the database, because this puppy is super old and I want to use TRY_CONVERT syntax in a query later.
ALTER DATABASE ContosoRetailDW SET COMPATIBILITY_LEVEL = 140;
GO
First, connect a session to the database. Don’t mess with the execution timeouts on this session, leave it at unlimited. Run a command like the following:
BEGIN TRAN
 DECLARE @OnlineSalesKey INT
 SELECT @OnlineSalesKey = OnlineSalesKey FROM dbo.FactOnlineSales WITH (UPDLOCK);
Now, connect a second session. In the connection dialog, select Options».
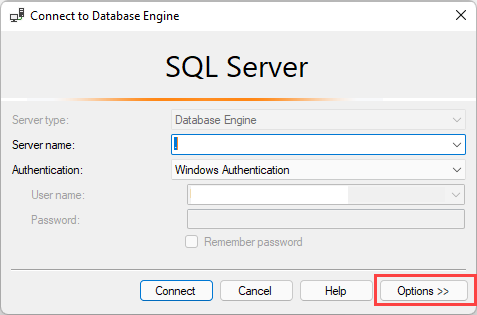
In the connection options dialog, set Execution time-out to 5 seconds.
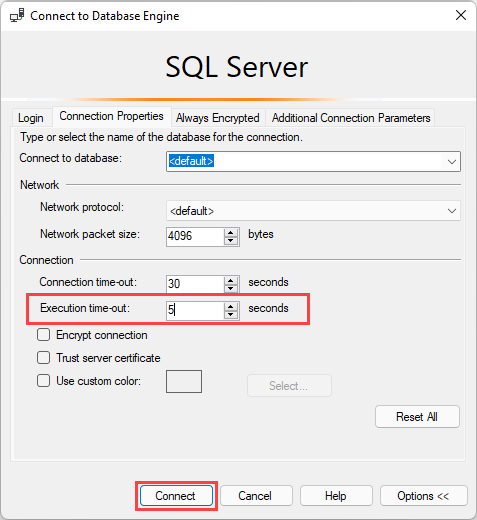
Select Connect.
Run the following query in this session:
SELECT MAX(DateKey) as MaxDate
FROM FactOnlineSales;
This query will be blocked by the query with the open transaction. After five seconds, you should see the error:
Msg -2, Level 11, State 0, Line 0
Execution Timeout Expired.  The timeout period elapsed prior to completion of the operation or the server is not responding.
Now, back in the first session, run:
ROLLBACK
Find the timeout in Query Store
To find timeouts in Query Store, you want to look for queries where execution_type in sys.query_store_runtime_stats is set to 3. Note that this isn’t only query timeouts– this status indicates ‘Client initiated aborted execution’. But in my testing I find that this includes query timeouts.
Here is a sample query against the Query Store DMVs looking for this status:
SELECT
 qst.query_sql_text,
 qrs.execution_type,
 qrs.execution_type_desc,
 qpx.query_plan_xml,
 qrs.count_executions,
 qrs.last_execution_time
FROM sys.query_store_query AS qsq
JOIN sys.query_store_plan AS qsp on qsq.query_id=qsp.query_id
JOIN sys.query_store_query_text AS qst on qsq.query_text_id=qst.query_text_id
OUTER APPLY (SELECT TRY_CONVERT(XML, qsp.query_plan) AS query_plan_xml) AS qpx
JOIN sys.query_store_runtime_stats qrs on qsp.plan_id = qrs.plan_id
WHERE qrs.execution_type =3
ORDER BY qrs.last_execution_time DESC;
GO
Here’s a screenshot of the results I see in SSMS for this query:
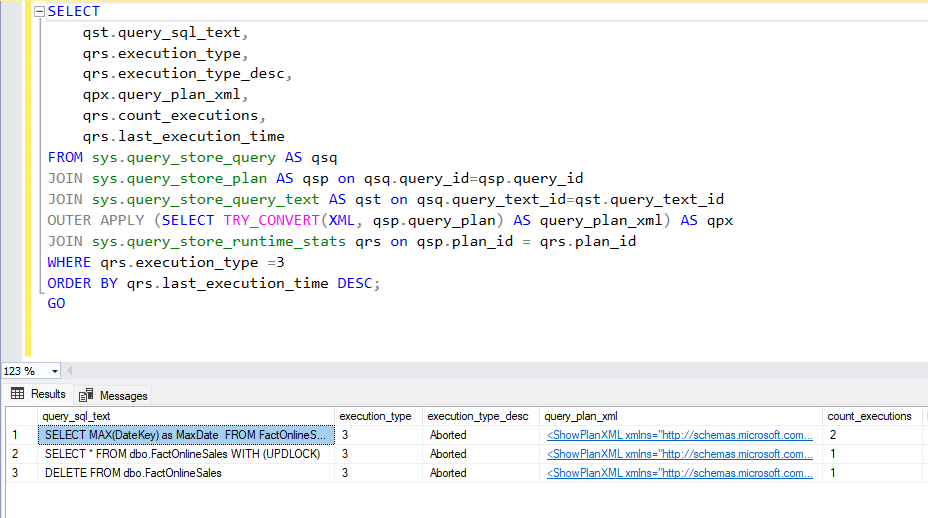
I clicked the “cancel executing query” button for the queries on rows 2 and 3 of this result set. The query on row 1 was run twice with the execution time-out setting in SSMS set to 5 seconds when I had the table locked in another session.
This isn’t perfect, but it’s worth checking
As I mentioned, you probably don’t want to capture all queries in Query Store in a production database. When timeouts strike, there’s no guarantee that Query Store has a record of the query. (This is true for all monitoring systems, really– there’s a performance tradeoff in observing things incredibly closely!)
However, if you have Query Store enabled, I definitely think it’s worth checking it for information regarding timeouts, as it’s a pretty quick and painless process to do so. If it doesn’t have the timeout data you’re looking for, you can always start up a trace and look for those Attention events as usual.
There’s a lot more cool things in Query Store
Query Store is an interesting thing. It doesn’t replace monitoring systems – because if your database is inaccessible, you can’t get to Query Store to figure out what’s wrong. It doesn’t alert you as to downtime or availability, that’s not its purpose.
However, Query Store does replace a lot of the performance tuning aspects of monitoring systems. It certainly can allow you to go cheaper on a monitoring solution and primarily look for availability monitoring, while doing most of your tuning and troubleshooting with Query Store.
 REGISTER