on June 19, 2017
Microsoft recently gave us a more lightweight way to trace data related to execution plan performance. As of SQL Server 2014 SP2, you can trace the query_thread_profile Extended Event.
But why doesn’t it show up in the Extended Events Wizard?
I’m a pretty lazy person, and for simple traces I typically just right click on the “Sessions” bucket under extended events and use “New Session”, then step through the GUI.
But when you step through this and go to add the query_thread_profile event, it’s… missing!?!?!
![]()
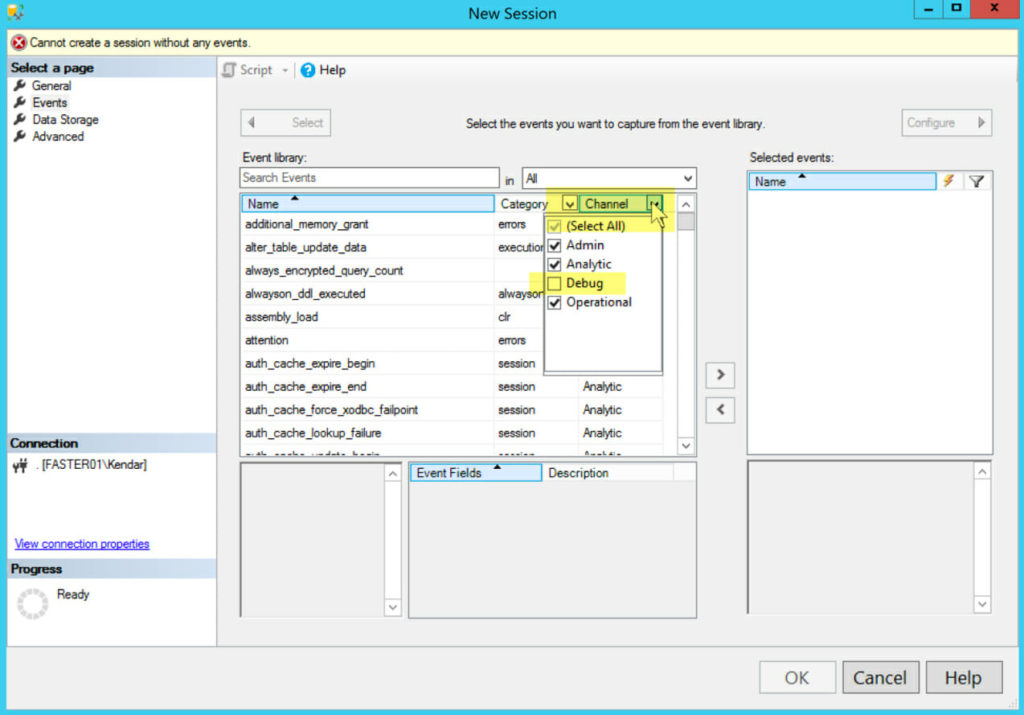
There’s a secret dropdown, called “Channel”
This was really hard for me to see. So hard that I looked at another explanation for it online, and completely missed what they’re talking about.
The word “Channel” is a dropdown. I thought that little carrot mark was for sorting events by type— and I had _no idea t_hat it contained entire categories of Extended Events that don’t show by default! Among those are the “Debug” events. Here’s the secret dropdown, highlighted in yellow….
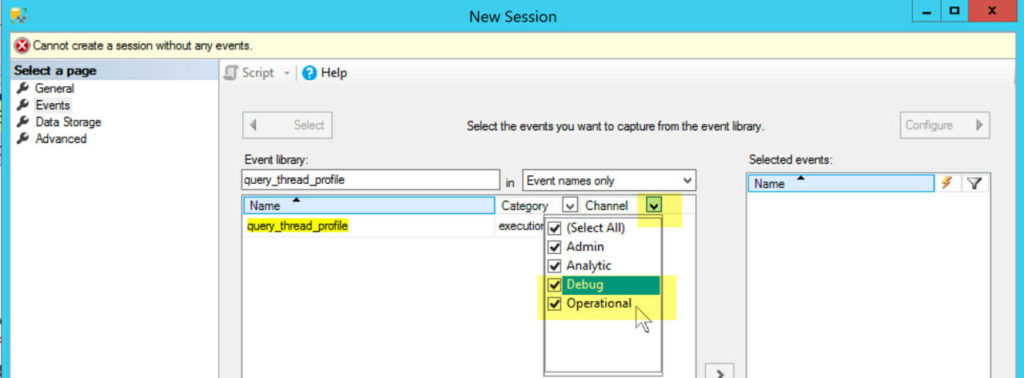
Once you check off “Debug”, the event shows up
Whew! Now you can add the event, configure your trace, and test out the feature very easily.
I’ve been using Extended Events for a while. I like them, but I find the GUI very non-intuitive. (Obviously.) In the past, I’ve had a few cases where I couldn’t figure out how to add an event without just scraping together the TSQL for it– and now I think I know why I couldn’t find it!