on November 25, 2016
Today’s question is about why a query might be slow at first, then fast the next time you run it.
Watch the 26 minute video or scroll on down and read the written version of the episode instead.
Dear SQL DBA,
Whenever I create a complex view, the first time I use it in a query, the query is slow. The same thing happens after I alter the view. What is the reason behind this?
This is a great question – because when you ask this question, you’re about to discover a lot of interesting, useful things about how SQL Server runs queries.
There are two ways that SQL Server can use memory to make a query faster the second time you run it. Let’s talk about how the magic happens.
It takes CPU time to figure out how to run a query. SQL Server uses memory to cache execution plans to save time the next time you run the query.
 The first time you run a query using the view, SQL Server has to ‘compile’ an execution plan to figure out the best way to run the query.
SQL doesn’t compile the plan when you create the view– it compiles a plan when you first use the view in a query. After all, you could use the view in a query in different ways: you might select only some columns, you could use different ‘where’ clauses, you could use joins.
Secretly, it doesn’t matter too much that you’re using a view. When you run a query that references it, behind the scenes SQL Server will expand the TSQL in the view just like any other query, and it will look for ways to simplify it.
So SQL Server waits to compiles a plan for the exact query you run.
- Depending on how many joins are in the view and how many ways SQL Server could run the query, it may take it a while to compile the query execution plan.
- SQL Server tries to come up with a decent plan quickly. But I have seen some cases where query compile time took 5+ seconds, and query execution time was much smaller.
SQL Server is designed to store the execution plan for a query in memory in the execution plan cache, in case you run it again. It would be very costly for the CPUs to generate a plan for every query, and people tend to re-run many queries.
If you re-run a query and there is already an execution plain in the plan cache, SQL Server can use and save all that compile time.
When you alter a view, this will force SQL Server to generate a new execution plan the first time a query uses the view afterward. Something has changed, so SQL Server can’t use any plans that were in cache before.
Restarting the SQL Server, taking the database offline and online, memory pressure, and many server level settings changes will also clear execution plans out of cache, so you have to wait for a compile.
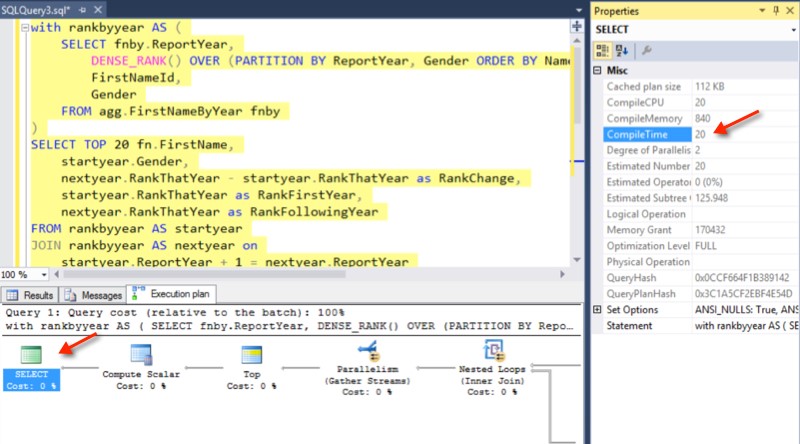
How much time are you spending compiling?
There are a few ways to see this:
- If you are testing and want to see how much time is spent on compiling, you can run in your session: SET STATISTICS TIME ON; After that, SQL will show you the ‘parse and compile time’ for each query in your ‘Messages’ window for that session.
- If you’re looking at execution plans, ‘compile time’ is stored in the XML. You can see it in the properties on the upper left-most operator. It’s reported in milliseconds and is the same as the ‘elapsed time’ that appears under parse and compile time from SET STATISTICS TIME.
- Query Store collects compilation time statistics, including compile duration. You can see some of the details in this post I wrote on Query Store and recompile hints.
Views aren’t really a problem. Sometimes, lots of joins are a problem, but SQL Server still has tricks to compile a plan quickly.
When people use complex views, particularly nested views, they often end up with a LOT of joins in each query.
When SQL Server has a lot of joins, optimization gets harder. There’s a ton of ways the query would be executed.
The SQL Server optimizer doesn’t want you to wait a long time while it looks at every single thing it could possibly do. It takes some shortcuts. It wants to get to a good plan fast.
Generally, SQL Server tries to keep optimization times short, even when you have a lot of joins.
But there are cases where sometimes compilation takes longer than normal.
What if you see multiple seconds of parse and compile time?
Usually compilation time is a number of milliseconds, but I have seen some cases where it’s seconds. This could be for a few reasons:
- SQL Server had to wait for CPU when it was trying to compile the query. It’s not the query’s fault, there just weren’t processors available. I would look at SQL Server’s wait statistics to identify this. If there were notable SOS_SCHEDULER_YIELD waits in that time period, the issue is more server load than the specific query.
- You’ve hit an identified bug for compile time. Some cumulative updates for SQL Server fix long compilation times. It’s worth looking at the version of SQL Server you’re on, setting up a fully patched test instance, and checking if applying updates might improve your compilation times.
- You’ve hit an unidentified bug for compile time. SQL Server works pretty hard to compile plans quickly, so multi-second compile time usually looks like a bug to me, if it’s not due to server load. For views and complex queries, I would:
- Look to see if I could simplify the query where-ever possible, to make things easier for the optimizer.
- Check if indexes might simplify the plan. Good indexes can make choosing a good plan easier and faster.
- Try query hints as a last resort. The problem is that hints are really directives, and force a behavior – what’s beneficial to force today may not be so great after the next upgrade, or even if my data sizes change over time.
It takes time to read data from disk. SQL Server uses memory to cache data in the Buffer Pool so it doesn’t have to go to disk the next time you use that data.
There are more reasons that the second run of a query might be faster.
The first time you run the query it may be using data that is on disk. It will bring that into memory (this memory is called the “buffer pool”). If you run the query again immediately afterward and the data is already in memory, it may be much faster – it depends how much memory it had to go read from disk, and how slow your storage system is.
When you are testing, you can see if your query is reading from disk (physical reads and read ahead reads) by running: SET STATISTICS IO ON;
One difference with this type of memory is that your buffer pool memory is not impacted by ALTERING the view. SQL Server does not dump data from the buffer pool when you change a view or procedure. Instead, it keeps track of how frequently different pages of data are used, and ages out the least useful pages from memory over time.
So this might be part of the answer in your case, but it wouldn’t necessarily explain why the query would be slower on the first run after an ALTER – unless the data pages that you’re using just hadn’t been queried a while and were no longer in the buffer pool cache by chance.
Takeaways for testing queries
I usually tune queries with a “warm cache”
Most queries that reference commonly used tables have a good chance of the data they need being in cache.
To test against a warm cache, I run the query once, and don’t pay a ton of attention to that first run.
I run the query again and measure the duration with the execution plan cached and the data pages in the buffer pool.
You can tune with a “cold cache”, but be careful
If I have a reason to believe that the data won’t be in cache when the query is run, then I will test it against a “cold cache”. I might need to do this if it’s a nightly query that runs, and the data it uses isn’t relevant at all to the daytime workload– so the pages are likely to not be in the buffer pool when it’s time for the job to run that night.
To test against a cold cache, you have to do some things that are NOT friendly for a production server – so make sure you only use this approach against test instances:
- Run DBCC DROPCLEANBUFFERS to flush unmodified pages from the buffer pool. (This will slow down your whole instance because EVERYBODY then has to start reading from disk)
- If modifications have been happing as part of the test, run a manual CHECKPOINT to flush dirty pages to disk from the buffer pool
- Use RECOMPILE hints or a variant of DBCC FREEPROCCACHE to make sure I measure compilation time each time